 Figure 60: Drawings of descriptions and drawings of explanations
content
Drawings of descriptions
Drawings of explanations
Drawings of descriptions
Extreme reduction of facts
In the realm of illustrating and visualizing knowledge, we find many examples for an extreme reduction of facts, e. g.
· The „spanograph“ by the English chemist Joseph Priestley (1769), a „chart of biography“ of 2000 personalities who lived between 1200 BC and 1750 AC: Their entire life is represented just by a bar of some inches length
· The „Carte Figurative“ of Charles-Joseph Minard (1869) showing the successive losses suffered by Napoleon’s army in his Russian campaign from 1812 to 1813
· The „Poverty map of London“ by Charles Booth (1890) which shows the diverse social strata by different colors
· The bar chart visualizing the schedule of a project by Karol Adamiecki („Harmonograph“; 1896) and Henry Gantt (1910)
· The „Viennese method of picture statistics“ of Otto Neurath (1933) visualizing population data of birth and death by lines of a little sketch of a baby and a little sketch of a coffin.
An impressive collection is found in Jacques Bertins „Semiologie graphique“ (1967; English: Semiology of Graphics: Diagrams, Networks, Maps, 1983).
20th century: Block diagrams
A early stage of block diagrams was used by Jakob von Uexküll in his „Theoretische Biologie“ (1920, 116) to show the function circle ( „Funktionskreis“) between organism and envrionment. The painter Paul Klee drew a scheme concerning "man and cosmos" in his essay "Wege des Naturstudiums" (1923; see Ellen Judith Beer 1980, 200).
The first schemes of feed-back loops we find in Norbert Wiener’s “Cybernetics” (1948, Chapter 4, 112ff).
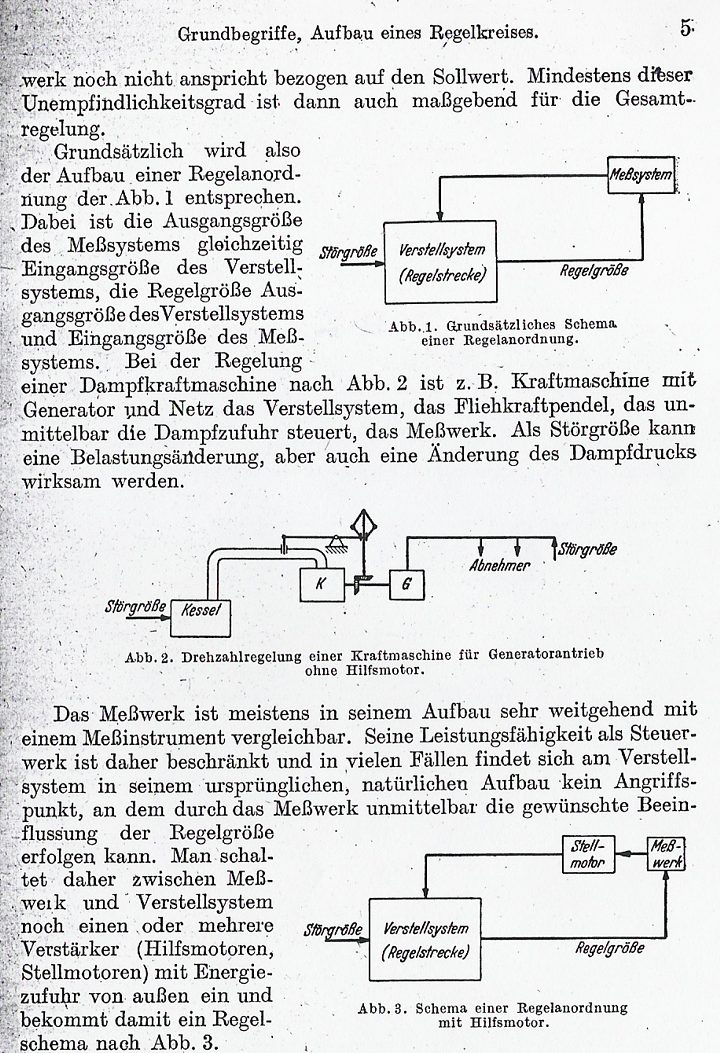
Some early block diagrams in technics we find in the second edition of Adolf Leonhard’s book on automatic control (“Die selbsttätige Regelung“, Berlin: Springer 1949, 5).
Drawings of explanations
Brian J. Ford (1992, 146-147; 136-137) shows some drawings to explain the ellipses of the Moon and Sun from a fifteenth-century English manuscript of „L’Image du Monde“ by Gautier of Metz (ca. 1250) and a fine drawing of Robert Hookes „Micrographia“ (1665) on the predictable shape of crystals. Ford says: „Hooke shows a series of what we might now term ‚molecular models’, relating their orientation to the facets that must result (137)“.
Leonardo da Vinci: blown-up drawing
Around 1500 Leonardo da Vinci introduced the blown-up drawing – or, exploded view - to demonstrate how and in which sequence parts of an object were bonded (for an example see [Peter Jeffrey Booker, 1963, 217; Wolfgang Lefèvre et al., 2003, 84]). Although his sketches were never published, he intended them to be used in textbooks.
More drawings through the ages
Some more drawings of explanations we find in the illustrated volume of Harry Robin (1992), e. g.
John Holywood (1220/ 1488) explanation the eclipse of the moon
Johannes Kepler (1596) model for the orbits of the planets
William Harvey (1628) circulation of the blood
Athanasius Kircher (1671) chart of comparative cosmologies
Robert Boyle (1680) „spring of the air“
Stephen Switzer (1729) water cycle
René Just Haüy (1801) speculation on crystal structure
Charles Darwin (1862) fertilization of flowers
Friedrich August Kekulé (1865) benzene ring
James Clerk Maxwell (1871) experimental lines on paper
Paul Ehrlich (1900) theory of immunity
Alfred Wegener (1915) origin of continents and oceans
René Descartes drew many explanations
It is interesting to see that it was a philosopher, René Descartes, who drew many explanations for physical and physiological phenomena (Rainer Specht, 1966), e. g.
· Formation of a rainbow (1637)
· Visual perception (1637 and 1664 – Specht, 86, 130 and back page)
· Vortex theory of space (1640 – Specht, 106)
· Constitution of mountains (1644 – Specht, 107)
· Response to the heat of fire (1664 – Specht, 122, 129).
bibliography
Abbildungen – Illustrationen
Grafische Darstellung, Blockschaltbilder
Dr. phil. Roland Müller, Switzerland / Copyright © by Mueller Science 2001-2016 / All rights reserved
Webmaster by best4web.ch